

Learn How to Monitor Your Website Activity from the Server
You check website activity from hosting server and log in to your hosting server’s control panel. Navigate to the logs or statistics section.
Monitoring your website activity log is crucial for maintaining security and optimizing performance. These logs provide detailed information about visitor behavior, server requests, and potential errors. Accessing these logs helps identify issues, track user interactions, and improve the overall user experience.
Hosting servers usually offer built-in tools to view these logs, making the process straightforward. Regularly reviewing your website activity can also aid in detecting suspicious activities, ensuring your site remains secure. Understanding how to access and interpret these logs is an essential skill for effective website management.
Credit: devblogs.microsoft.com
Accessing The Hosting Server
To check your website activity log, access the hosting server first. This process involves logging in with your credentials and navigating the server control panel.
Login Credentials
First, gather your login credentials. Your hosting provider usually provides these details. They include your username and password. Keep these credentials safe and secure.
Go to your hosting provider’s website. Look for the login button. Enter your username and password. Click the login button to access your account.
Server Control Panel
Once logged in, you will see the server control panel. This panel is the hub for managing your website. Look for options like cPanel or Plesk. These are common types of control panels used by hosting providers.
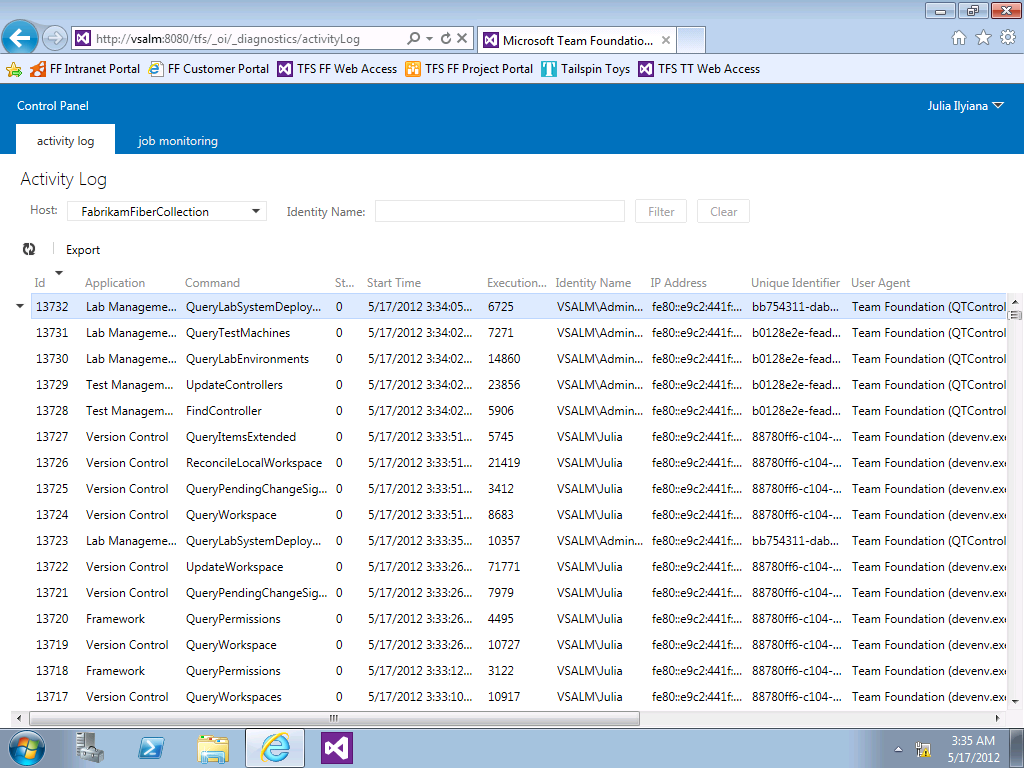
In the control panel, find the section labeled Logs or Statistics. Here, you can view your website activity log. This log will show you important data, such as visitor details and error messages.
Use these steps to access your hosting server and check your website activity log easily.

Credit: www.reddit.com
Locating The Activity Logs
To troubleshoot issues or monitor your website, you need to access the activity logs. These logs help in understanding what happens on your website. They are stored on your hosting server. Let’s explore how to locate these logs.
Common Log File Locations
Activity logs can be in different directories. Here are some common locations:
- /var/log/ – Often used for system logs.
- /home/your username/logs/ – User-specific log files.
- /usr/local/apache/logs/ – Apache server logs.
- /etc/httpd/logs/ – Logs for HTTPD service.
- /var/log/nginx/ – NGINX server logs.
Using File Manager
Most hosting providers offer a File Manager. This tool helps you browse server directories. Follow these steps to access your logs:
- Login to your hosting control panel.
- Navigate to the File Manager section.
- Open the directory where logs are stored.
- Look for files like error.log or access.log.
- Download or view these files to check activity.
Table of Common Log Files:
| Log File | Description |
|---|---|
| error.log | Records errors encountered by the server. |
| access.log | Logs all requests made to the server. |
| debug.log | Contains debugging information. |
Accessing these logs can help you maintain your website. It allows you to identify and fix issues quickly.
Using Cpanel For Logs
cPanel is a widely-used web hosting control panel that simplifies managing website activities. It offers a user-friendly interface for accessing various tools, including log files. These logs are crucial for monitoring website performance and identifying issues.
navigating To Cpanel
To access cPanel, open your web browser. Enter your domain followed by “/cpanel”. For example, www.yourdomain.com/cpanel. Enter your username and password to log in.
accessing Log Tools
Once in cPanel, locate the Metrics section. Here, you’ll find several tools for accessing logs:
- Visitors: Displays detailed information about recent visitors.
- Errors: Shows the last 300 errors that occurred on your website.
- Raw Access: Provides raw log data for further analysis.
- Bandwidth: Displays data usage for your website.
- Awstats: Offers detailed traffic reports and statistics.
Raw Access and Errors are particularly useful for troubleshooting issues. Download raw access logs for offline analysis if needed.
| Log Tool | Purpose |
|---|---|
| Visitors | Recent visitor details |
| Errors | Website error reports |
| Raw Access | Raw log data |
| Bandwidth | Data usage |
| Awstats | Traffic reports |
Use these tools regularly to keep track of your website’s health. Monitoring logs helps in maintaining optimal performance and security.
Using Ftp To Download Logs
Website activity logs are crucial for monitoring your site’s performance and security. Using FTP to download logs offers a straightforward way to access this data. This guide will walk you through the process step-by-step. Follow these instructions to ensure you can easily manage your website activity logs.
Setting Up Ftp
First, you need to set up an FTP client. Popular options include FileZilla and Cyberduck. These clients will help you connect to your hosting server.
Steps to set up an FTP client:
- Download and install your chosen FTP client.
- Open the FTP client and go to the settings menu.
- Enter your FTP credentials provided by your hosting server.
- Save these settings for future use.
Once set up, you are ready to connect to your server. Ensure your internet connection is stable before proceeding.
Transferring Log Files
After setting up the FTP client, you can now transfer log files. Follow these steps:
- Open your FTP client and connect to your hosting server.
- Navigate to the directory containing the log files. This is usually named ‘logs’ or ‘access_logs’.
- Select the log files you wish to download.
- Drag and drop the selected files to your local computer.
Make sure to store these log files in a safe location. Regularly check and analyze these logs to monitor your website’s activity.
Using FTP to download logs is a practical method for managing website activity. By following these steps, you can ensure that your website remains secure and performs optimally.
Analyzing Log Data
Log data helps you understand your website’s activity. It includes visitor details, errors, and performance metrics. Learning to analyze this data can improve your website’s health.
Interpreting Common Entries
Understanding log entries is crucial. Logs often contain IP addresses, timestamps, and request types.
- IP Addresses: Identifies the visitor’s location.
- Timestamps: Shows the exact time of requests.
- Request Types: GET and POST are common request types.
These entries can help you track user behavior. For example, you can see which pages are visited most.
Identifying Issues
Log data can also highlight issues. Look for error codes like 404 or 500. These indicate missing pages or server issues.
| Error Code | Description |
|---|---|
| 404 | Page Not Found |
| 500 | Internal Server Error |
Fixing these errors can enhance user experience. Regular log checks help keep your site running smoothly.
Credit: learn.microsoft.com
Automating Log Monitoring
Monitoring website activity logs manually can be time-consuming. Automating this process ensures timely detection of anomalies. It also saves valuable time. Automation tools help track logs efficiently. You can use scripts and alerts for automation.
Using Scripts
Scripts can automate log monitoring easily. They can scan logs for specific keywords. These scripts can also filter data based on criteria. Here is an example of a simple script:
#!/bin/bash
log_file="/var/log/website.log"
keyword="error"
grep $keyword $log_file
This script searches for the word “error” in the log file. You can modify it to suit your needs. Scripts can be scheduled to run at regular intervals. Use cron jobs for scheduling on Linux servers.
Setting Up Alerts
Alerts notify you of any unusual activity. They help you respond quickly to potential issues. Setting up alerts involves configuring your monitoring tools. Follow these steps to set up alerts:
- Choose a monitoring tool.
- Configure the tool to scan your logs.
- Set thresholds for alerts.
- Define notification methods (email, SMS, etc.).
Here is a table showing popular monitoring tools:
| Tool | Features |
|---|---|
| Loggly | Real-time log analysis, alerting |
| Splunk | Comprehensive log management, customizable alerts |
| Graylog | Centralized log management, flexible alerting |
Automating log monitoring enhances your website’s security. It helps in maintaining smooth operations. Use scripts and alerts to stay informed about your website’s activity.
Best Practices
Monitoring your website’s activity log is essential. It helps you ensure security and performance. Following best practices ensures you get the most out of your logs.
Regular Monitoring
Regularly checking your website activity log helps detect issues early. You can spot unusual activities before they become serious problems. Schedule frequent log checks to stay on top of things.
Use an automated tool to make this easier. Automated tools can send alerts for specific events. This helps you act quickly if something goes wrong.
| Frequency | Action |
|---|---|
| Daily | Check for login attempts and errors. |
| Weekly | Review traffic patterns and unusual activities. |
| Monthly | Audit access permissions and user activities. |
Securing Log Files
Securing your log files is critical to prevent unauthorized access. Store logs in a safe location with limited access. Use strong passwords and encryption to protect them.
Keep your log files for an appropriate time frame. This ensures you have historical data if needed. Follow your organization’s data retention policy for this.
- Restrict access to log files.
- Use encryption to secure log data.
- Regularly back up your log files.
- Follow data retention policies.
Storing logs off the main server can add an extra layer of security. This way, even if the main server is compromised, logs remain safe.
Frequently Asked Questions
How To Check Website Activity from Hosting Server?
To check server logs, access the server via SSH. Navigate to the log directory, usually `/var/log/`. Use commands like `tail`, `cat`, or `less` to view log files.
How Do I Check My Website Logs?
Access your web hosting control panel. Navigate to the “Logs” section. Select the desired log file to view.
How To Get Web Server Logs?
Access web server logs via your hosting control panel or SSH. Navigate to the logs section or use the command line.
How To Get Log Files Of A Website?
Access your website’s server or hosting control panel. Navigate to the logs section. Download the desired log files.
How To Access Website Activity Logs?
Access your hosting control panel. Navigate to the logs section. Select the desired log file to view.
What Are Website Activity Logs?
Website activity logs record user actions, visits, errors, and server responses. They help in monitoring and troubleshooting.
Conclusion
Mastering website activity logs enhances security and performance. Regular monitoring helps identify issues and optimize your site. Utilize your hosting server’s tools efficiently. Stay proactive to maintain a healthy website. Keeping track of activity logs ensures a seamless user experience and a secure online presence.